QtiPlot - Data Analysis and Scientific Visualisation
Try for free
Home
Download
Buy
Pricing
Invoice
Payment
Contact
Support
Manual
FAQ
Tutorials
News
Latest
Archive
Latest News
2020/04/30 - QtiPlot 1.0.0-rc12 release available. New features and improvements:
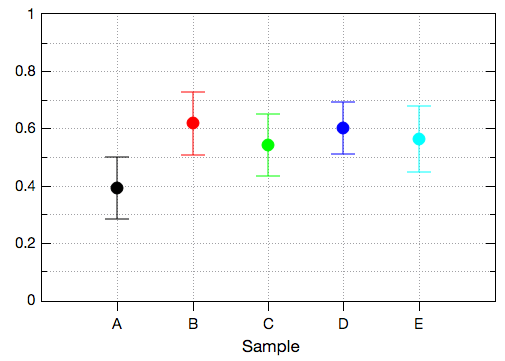
Implemented new statistical plot types:
interval plot
,
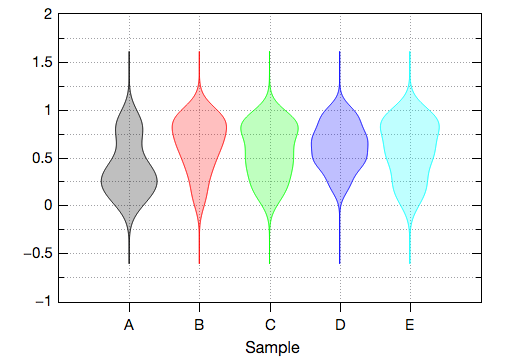
violin plot
,
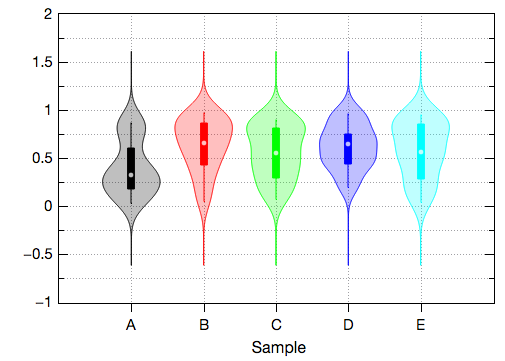
violin with box
,
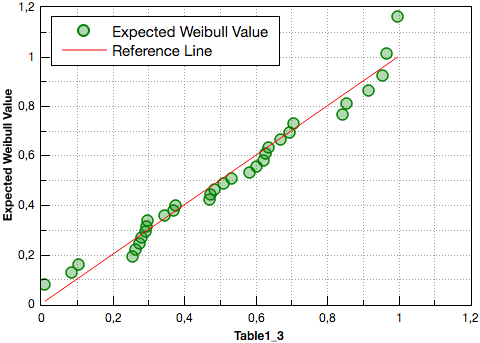
QQ probability plot
and
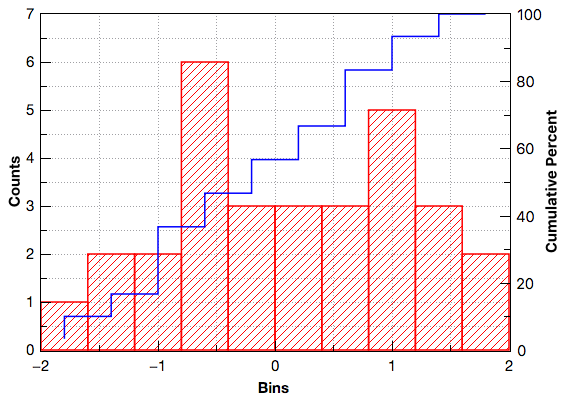
double Y histogram + probabilities plot
.
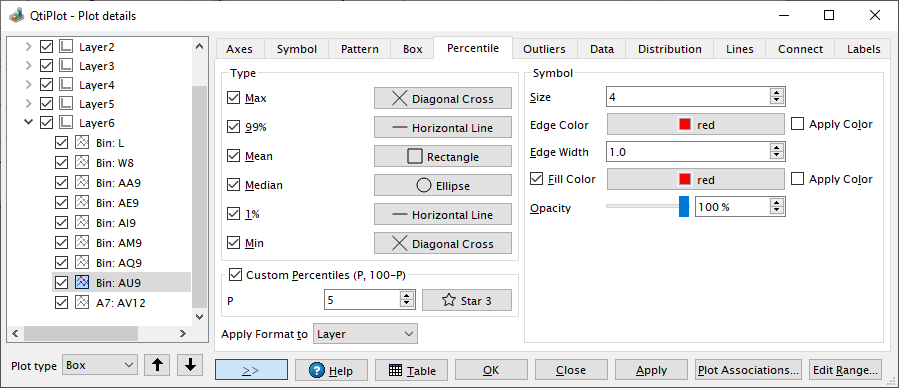
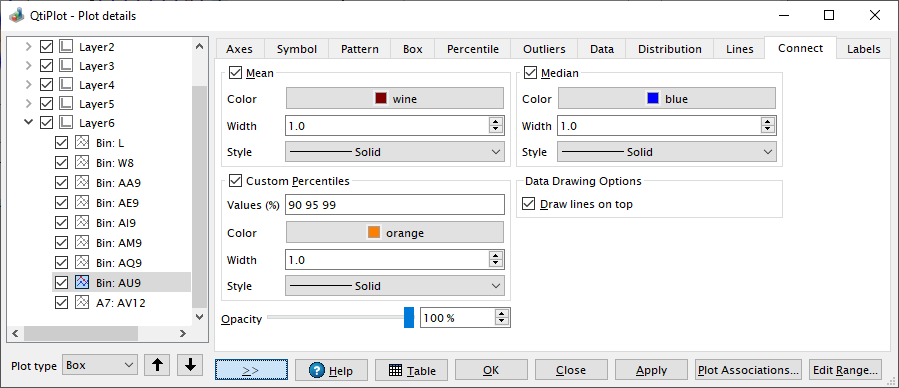
Improved box plots: added the possibility to
draw a symbol for a custom percentile and for the the median
.
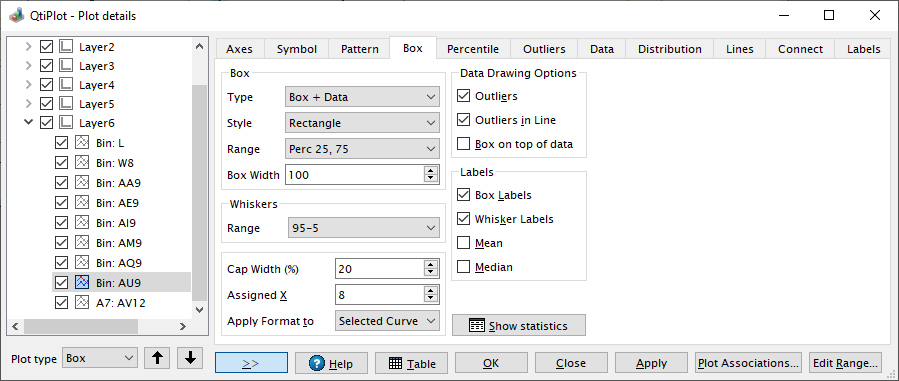
Improved box plots: added the possibility to
enable/disable the display of lines and labels for the mean and median percentiles
.
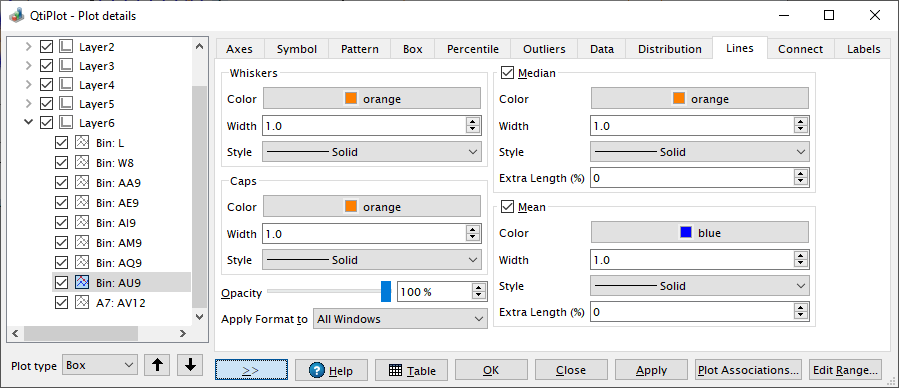
Improved box plots: added the possibility to
customize the line pen for whiskers and their caps and to set a custom caps length
.
Implemented I-shaped box plots.
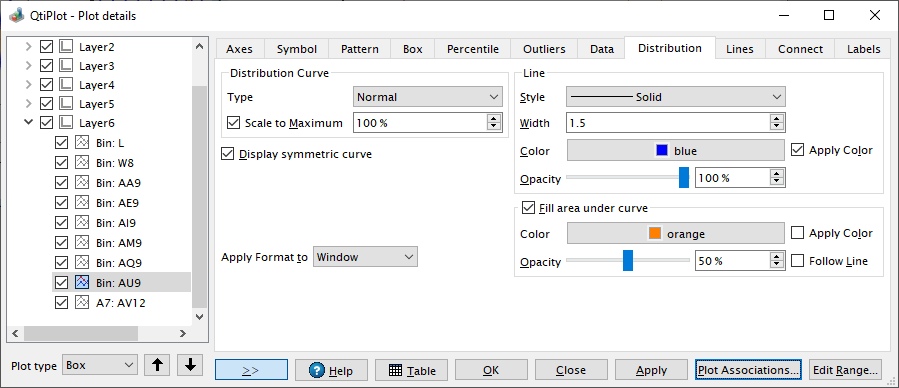
Added the possibility to display a distribution curve for box charts even if the data bins are not drawn.
Added the possibility to
show symmetric distribution curves for box plots
.
Implemented the possibility to
add connect lines between the means, medians and user defined percentiles for groups of box plots
.
Improved mouse selection of box curves.
Added the possibility to customize all histogram distribution curves in a project with just a few clicks.
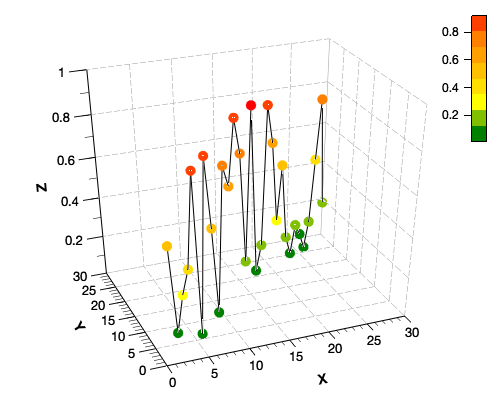
Added new 3D plot style:
Trajectory + Dots
.
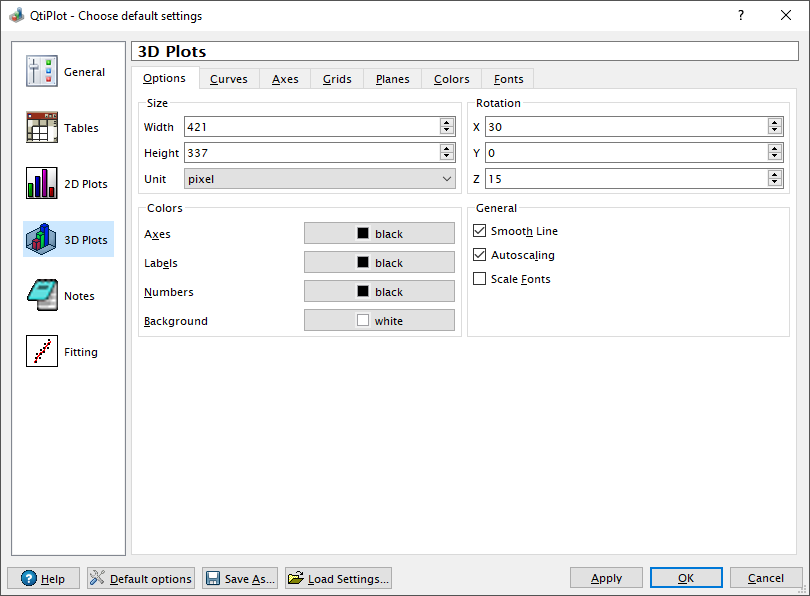
Improved
preferences dialog for 3D plots
: users can set the default style for the coordinates system and a default line width for 3D curves.
Implemented the possibility to plot matrices using templates.
Added the possibility to apply templates to existing 3D plots.
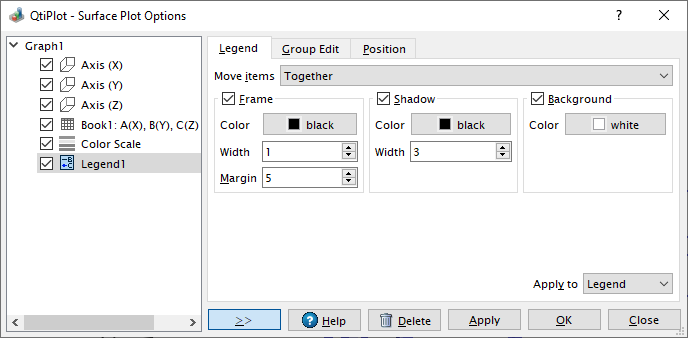
Improved 3D plots:
users may define custom tick lengths for the color legend
.
Improved creation of 3D plots from Z table columns via templates.
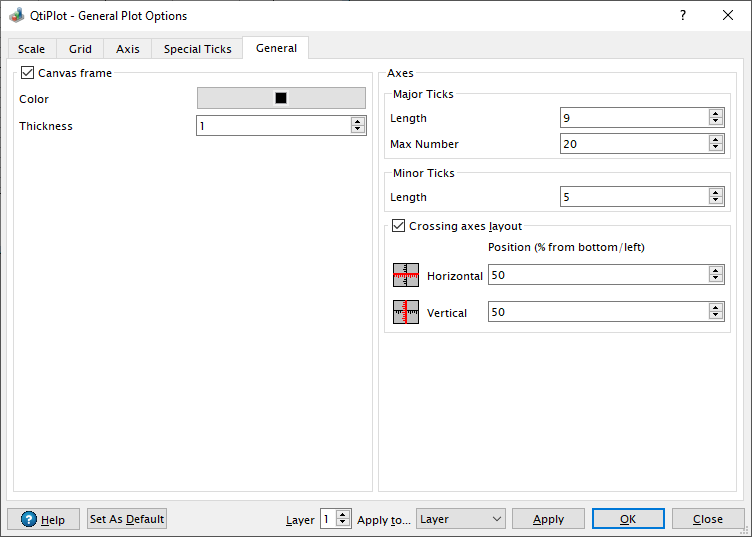
Added the possibility to
set a crossing axes layout for existing 2D plots
.
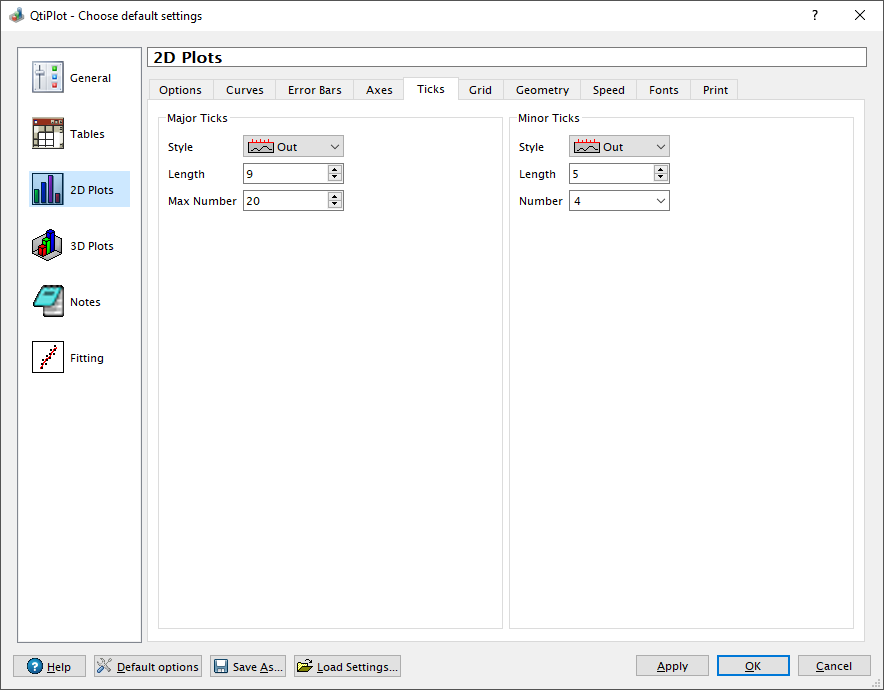
Implemented the possibility to
customize the default number of minor ticks for 2D plot axes via the preferences dialog
.
Improved handling of constant parameters in Fit Wizard and eliminated some superfluous error messages.
Improved layout of the Fit Wizard.
Added 'Insert Column' and 'Insert Row' actions to the 'Table' menu and to the
Column toolbar
.
Reorganised
Column toolbar
.
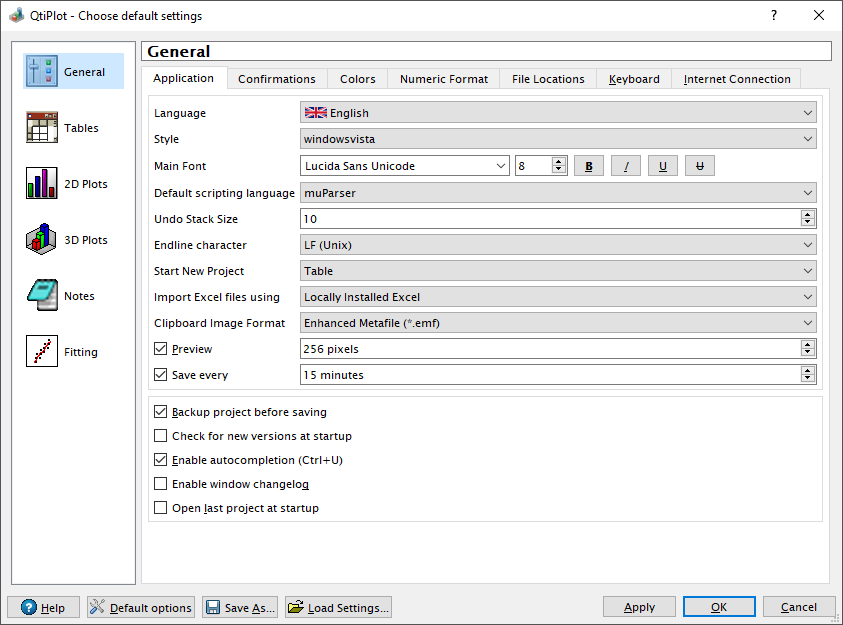
Added the possibility to
disable the display of a window preview image in the project explorer
.
Made possible to customize the fill color of plot symbols for all 2D plot curves in a project via the Plot details dialog with a few clicks.
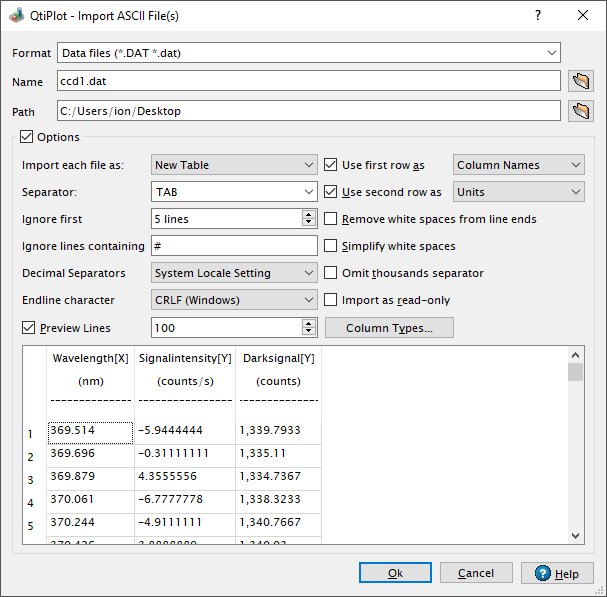
Implemented the possibility to
import column units from ASCII files
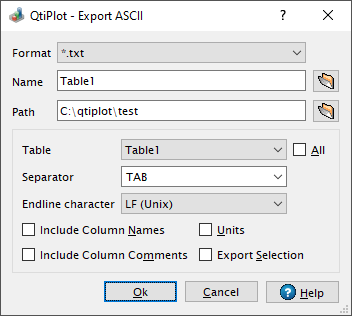
and to
export column units
from tables.
Improved initialisation of font sizes for high dpi screens.
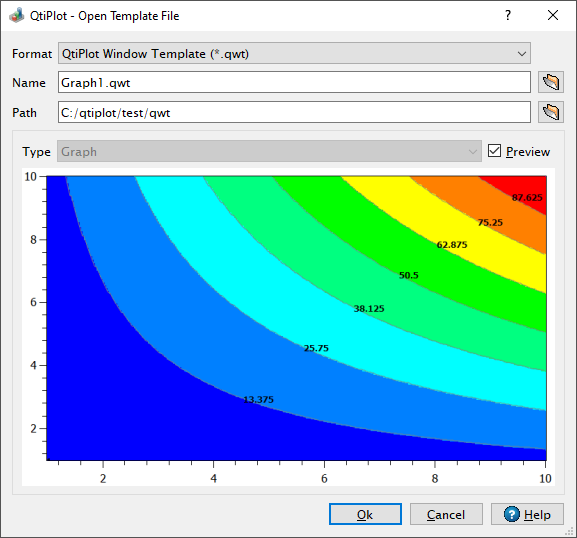
Added the possibility to
preview a window template in the file opening dialog
.
Added support for importing OriginLab 2020 project files.
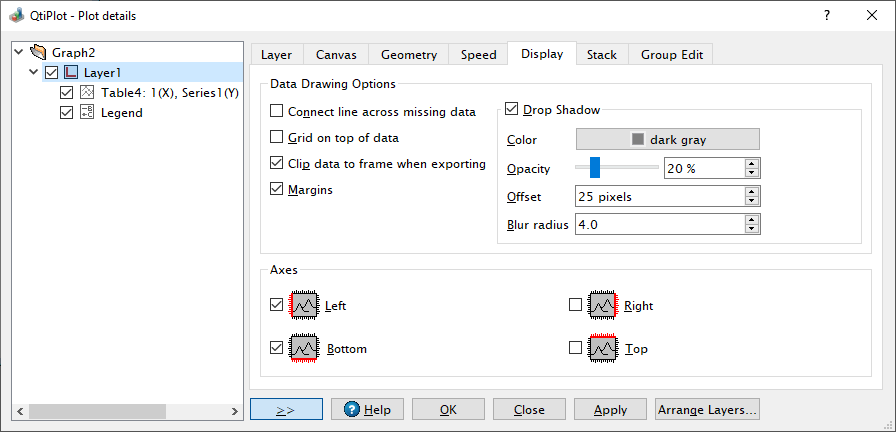
Added support for setting the
opacity of the 2D curve shadows
.
Improved import of Excel charts on Windows: added support for importing Bubbles and 2D curve shadows.
Improved keyboard navigation between 2D curves using the data reader tool.
Added the possibility to resize 2D plot images using interpolation.
Implemented the possibility to fill 2D bar/column curves using a color map based on the data values in a table column.
Added two actions to the Graph menu allowing to fit layers to window size and to fit window size to layers.
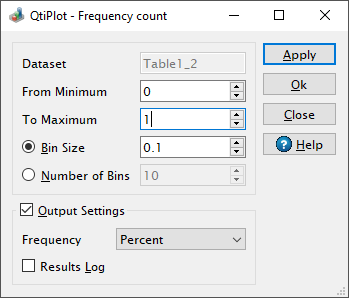
Improved
frequency count dialog
.
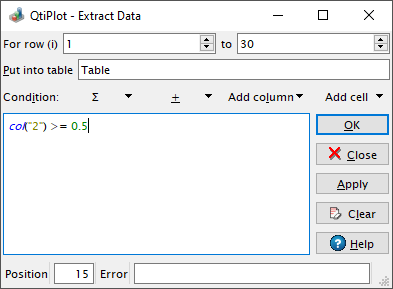
Improved
extract table data dialog
.
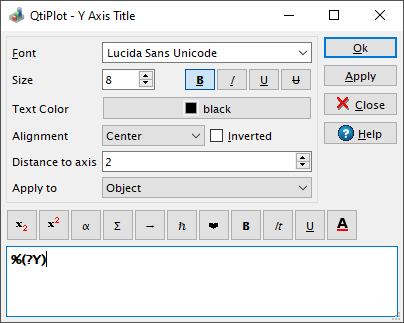
Improved
font handling
in various dialogs.
Implemented file name auto completion in ASCII file import dialog.
Bug fixes:
Fixed loading of pie chart labels.
Fixed crash that may occur in very particular cases when deleting last column in a table.
Fixed reloading of vector curves when source data columns change.
Fixed saving/restoring of color scale widgets.
Fixed handling of nonzero baseline values for column/bar plots.
Fixed initialisation of axes titles when drawing 2D bar plots.
Fixed wrong loading of disabled grids in 3D plots.
Fixed handling of line smoothness for 3D plot curves.
Fixed loading of 3D plot templates.
Fixed the list of depending graphs for matrix windows in the project explorer.
Fixed export of non solid grid lines from 3D plots to vectorial image formats.
Fixed multiple selection in the project explorer.
Fixed bug in Plot Associations dialog that lead to removal of a curve if the column names contained the dot character.
Fixed crash on macOS when loading projects created with release 0.9.9.8 that contain 3D plots.
Fixed system error messages when building with Python 3.
Fixed empty Correlation/Autocorrelation plot from fully selected table columns.
Fixed wrong modification of the number of minor ticks after adding new curves to a 2D plot.
Fixed bug in 2D function dialog causing generation of invalid constant parameters.
Fixed weights initialisation in fit operations affecting auto recalculation.
Fixed crashes on Windows when loading TIFF images with 32bit samples.
Fixed opening of project files raising QXmlStreamReader errors when built with Qt5.
Fixed adding special characters in the 3D plot dialog on macOS.